
GEOL463
Seismic Displays
 Visualization is key to seismic data analysis
3D displays are mostly done interactively using workstations
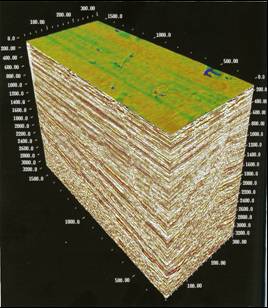
In this plot:
Visualization is key to seismic data analysis
3D displays are mostly done interactively using workstations
In this plot:
nVertical axis is the two-way reflection travel time,
nHorizontal axes give the collocated source-receiver coordinates,
nColor represents reflection amplitudes
nThe color-coded upper surface is the water bottom.
Note the acquisition footprint (striations on the water-bottom surface along the acquisition lines)